Visualize This: the Opportunity of Retail Network Data
Oh, Facebook. Everyday, we log in to check out our news feed, update our status, see who posted to our wall or tagged us in incriminating photos from last weekend. Activities that were meaningless to most of us five years ago are now ingrained into our daily lives. And with a speculated run at a $100+ billion dollar IPO, the analytics (and investor) community has experienced a huge surge of interest in network data and how the insights it generates can be decoded into massive amounts of frictionless cash.
Big data and statistical development blogs seem to publish new visualizations of network graphs on a daily basis. Applications such as NodeXL and LinkedIn Labs’ inMaps make the experience of extracting insights more accessible through tools we already use. I recently attended Predictive Analytics World (PAWCON) in San Francisco where a prevailing theme was how REAL companies (the kind where you have to wear pants to the office…I mean, rather than jeans) are using this kind of network data in core business functions across (arguably) mature industries like insurance, telecom, and health care. The big money in the analytics world, such as SAS and IBM/SPSS, all had an opportunity to demo their wares, both during the keynotes as well as in the exhibition hall, leaving me to conclude that the value in this data is real and is only beginning to be tapped.
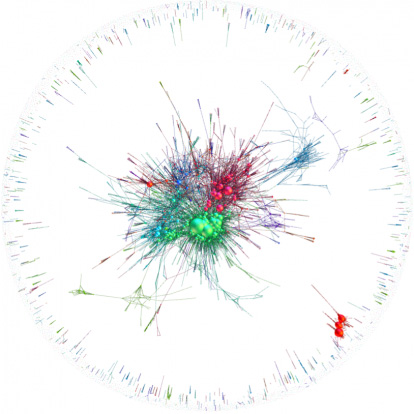
To apply network data meaningfully in the retail world, we looked internally to see what kind of value-adds similar approaches could yield with the data that we have at our fingertips. Taking the very basic case of retail transactions, we were able to describe a global basket analysis for one of our merchants using a single image of a network graph, as shown below, where a bubble represents a product, the colors represent the products’ departments (e.g., Electronics, Home and Garden, Clothing, etc.), and the size of the bubbles represents the depth of a product’s purchase network (i.e., with how many distinct products does this product get purchased?). 
There are literally thousands of things that this image tells us. At a high level, the general pattern that we IMMEDIATELY see is a core network of products surrounded by a peripheral set of one-off purchases (i.e., purchases of a single product or group of products that occur in isolation). The core spans all of the merchant’s departments but the majority of the product population exists in the surrounding halo. Interestingly enough, the one category that this merchant focuses on the most exists almost entirely in the halo, which begs the question: What are you doing wrong?
Another insight QUICKLY extracted from this graph is that the most frequently purchased products for this merchant are all from the Apparel department, with a distribution that leans toward women and children. Tightly connected with one distinct subset of this network of Apparel purchases is the Baby department, where purchases of items such as diapers, changing tables, car seats and cribs are made. What emerges from this one isolated case is two distinct behavioral personas: New Parents and Young Families. While these personas are closely related, there are literally hundreds of products unique to each that could be used as clues to generate dynamically personalized shopping experiences. And a year or two from now when that customer who bought a crib today returns, we will be able to present them with the dynamic shopping aisle appropriate for someone with a one to two year-old.
The derived insights from this image inspire several calls to action. First and foremost: experiment with different merchandising strategies that cater to these niche personas. We have limited time to interface with a customer; why waste an impression showing training diapers when the customer is browsing newborn cribs? Another would be to invest in identifying the maven products (to borrow the term from Malcolm Gladwell’s “The Tipping Point”) that are disproportionately frequent members of orders that span the virtual aisles: which Video Game is the lead in for purchases of all other video games/media/electronics/etc.? Which products just below the radar of top-seller rankings are in fact instrumental in closing multi-item, cross-departmental purchases? Promoting these products in the merchandising strategy could result in a windfall of new conversions and larger-than-expected average order values.
Perhaps the most daunting task is to expand the coverage of the core network, reaching out into the halo to reel in those seldom viewed/purchased products into more shopping carts. But one thing at a time…clear insight is but the first step in harnessing the latent power of network data.

