Scaling the peaks of Black Friday 2014: Shopping Insights and Metrics
We’ve finally slowed down enough to reflect on how we did in 2014 and the final holiday push: pretty darn great if I may say so myself. We ended another year at 100% uptime all year with record loads and HUGE growth.
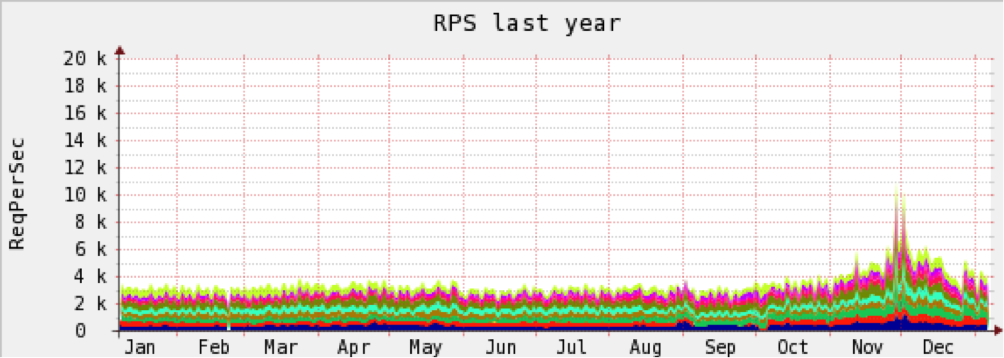
The graph below shows 2014 traffic, as measured in requests per second (RPS), highlighting the final Devil’s Horns through Jan 5. You can see Thanksgiving through Cyber Week and the dips in shopping on Christmas and New Years pretty clearly. Historically, the traffic we settle at by mid-January becomes the baseline for the next year. We typically gain online traffic each year from new customers but also see organic growth in the number of shoppers.
Each color below represents a different data center location.
Below is a close up of the Devil’s Horns with page views on the left, and days across the bottom. The colors represent the years 2008 to present. We peaked a bit over 400M RPS (graphing smooths the numbers by averaging across time, making them look lower).
Finally, here are some fun stats for December 2014:
We served 10,297,583,013 impressions, converting over 51B recs at 100% uptime!
The month’s top search terms were:
- Laptops
- Sale
- Tablets
- Mens
- Clearance
- Mens clearance
- iPad
- Boots
- Frozen
- Lego
We kicked off 2015 with the launch of the Relevance Cloud and look forward to another year of continued innovation in personalized customer experiences with our customers! Here’s to great shopping and good health to us all.
________________________________________________________________________________________________
Original Blog Post from 12/03/2014
It’s been a mere 36 months since I wrote my last blog entry on Black Friday/Cyber Monday traffic. So what has changed? Nothing, and A LOT! We are still up 100% on our front-end services (52 months and counting). We still have the industry leading response rates and infrastructure platform.
But in the past 5 days, we served:
• More than 17 billion recommendations (up from our previous record of 8B)
• Over 400 million page views on Black Friday (up from 215M last year)
• More than 17,000 peak requests per second on our servers (vs 7,000 in 2011)
And oh yeah, our speeds never wavered from our blazing-fast, industry-busting, top-of-the-line service. We’ve also graduated from Mountain Dew to espresso, from Rush tapes to downloaded Urban tunes. We’ve gone from five data centers in the USA and two data centers in Europe to 12 data centers, directly supporting South America, Eastern Europe and Asia.
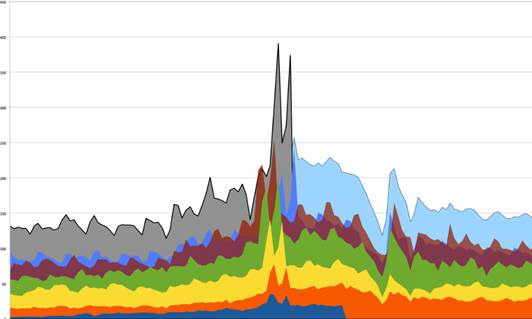
This year, we also invested in a great monitoring product, DataDog, as well as a fantastic scalable infrastructure. With DataDog we have the ability to track granular and custom metrics for that new infrastructure in a single place. Every year, I track the metrics of a number of IT operations that include requests per second, response times, model builds, transfer rates, load and page views (what I call the Devil’s Horns), for our 220+ global customers on over 500 sites for the most pivotal shopping weekend of the year. On my “Devil’s Horns” graph, the left “horn” shows Black Friday views and the right one shows Cyber Monday, with the dip further to the right being Christmas and Boxing Day spike following. In the graphs below, the gray shows current page views in millions, with each color below representing the previous 6 years (2008 to current).
Here are some highlights from our journey tracking the Devil’s Horns of 2014.
November 25: T-minus 2 days — Countdown to Thanksgiving.
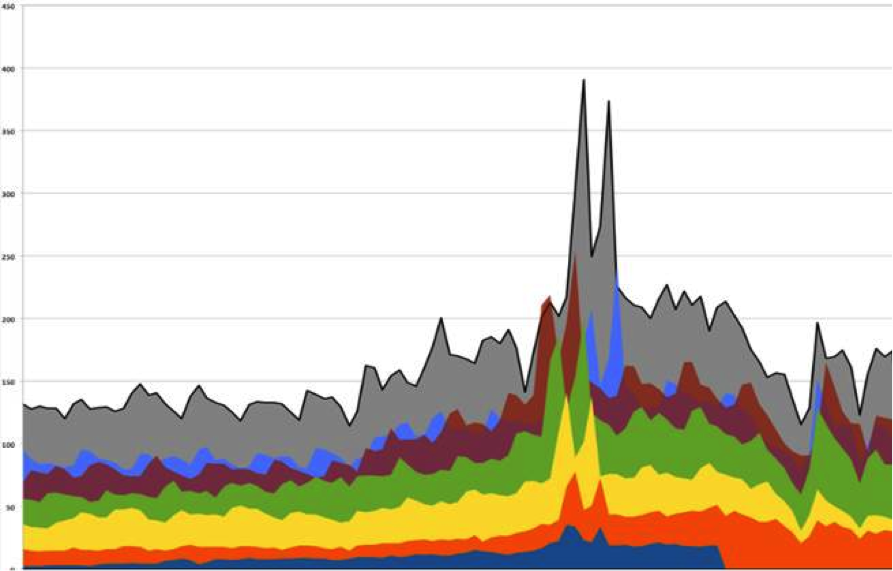
Here’s how we looked as we started to map the Devil’s Horns graph last week.
- We surpassed 215M page views on Monday of Thanksgiving week; by this time in 2012 we were only in the108M range.
Gray is 2014 recorded traffic for the days leading up to Thanksgiving. Light blue is projected traffic estimated from past patterns and current sizes. Scale = Millions of Page Views.
- We hit nearly 10K RPS (requests per second—over two times what a typical shopping day sees), two days before Thanksgiving evening. By comparison, we peaked at 13K on Black Friday morning last year. So barely below with 48hrs of growth to come.
November 27: Is Christmas Creep eating into Thanksgiving?
- We beat our previous Thanksgiving record by nearly 40% (> 300M page views vs 255M in 2012).
- As of 7:40 AM PDT Thanksgiving morning, we were at 9.4K Requests per Second (RPS), which was already higher than 2013’s peak of 9K RPS.
- We ran the whole day at a plateau of around 10K RPS, with our peak being 11,800 at 4pm.
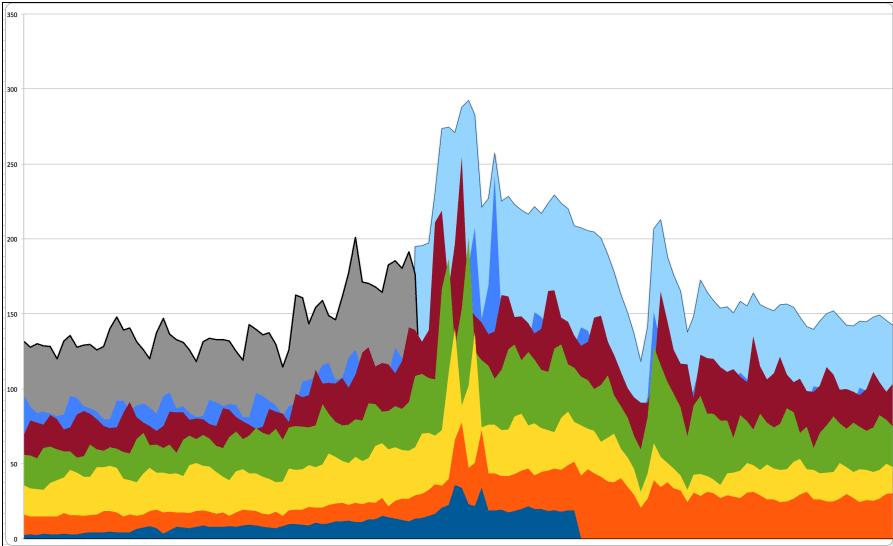
Gray is 2014 recorded traffic for the days leading up to and including Black Friday. Light blue is projected traffic estimated from past patterns and current sizes. Scale = Millions of Page Views.
It seems Thanksgiving has creeped its way to establish a solid Thanksgiving/Black Friday/Cyber Monday retail shopping trifecta! #ChristmasCreepIsReal. But we had another reason to give thanks today: no calls or merchant problems raised. That’s great news.
November 28. Black Friday continues to set records.
- Page views for Black Friday were over 400M. That’s not a typo, that’s Four. Hundred. Million. Our former high was the previous Cyber Monday with about 255M page views.
- Our steady states were really high at 7 – 9K per second with a plateau of 12K RPS, and we set a new record of 15,580 RPS at 8:20 AM PDT. The 7+K steady state overnight is double the HIGH mark of a regular shopping day; most normal overnight rates are about 1.5 – 2K and daily highs are 3.5 – 4.5K.
- We had a weird spike at 1 AM PDT on Black Friday: 7,500 RPS mostly coming out of EMEA (The dark blue and purple shaded area represent Amsterdam and Frankfurt data center traffic in the below charts). This corresponds with morning/midday hours in that region. This year the EU entered the USA Black Friday craze setting records both in store and especially online. In the UK, where Black Friday was fully adopted by an ever-increasing number of UK retailers, several websites crashed on Black Friday amidst shopping frenzy and near riots. Not us! Welcome to Black Friday, UK.
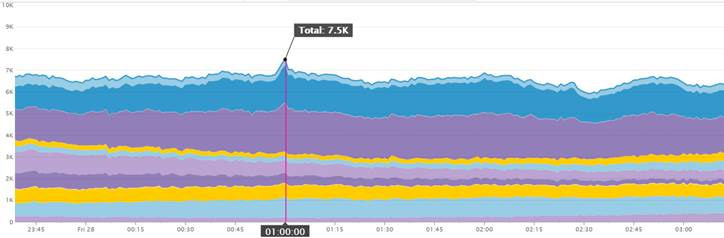
A mystery midnight mini peak.
Above is the overnight RPS graph zoomed in to show that weird sudden peak. I’m hoping the {rr} team in the EU was buying my team some treats.
Let’s also take a quick look below at the same RPS Graph worldwide for that 48 hours, from Thursday through Friday, to see that overnight traffic. That’s a lot of sleepy shoppers.
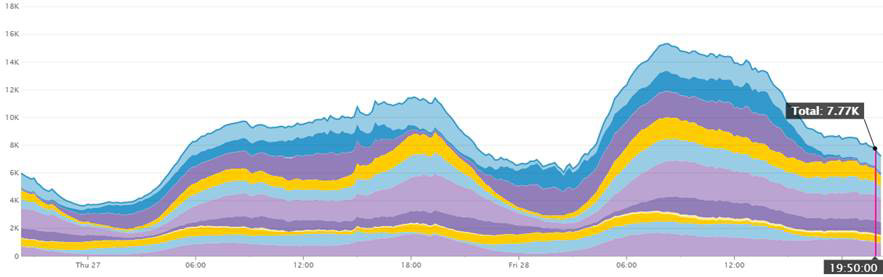
48-hour view of Thanksgiving and Black Friday.
December 1: Cyber Monday
- The whole weekend was solid with midday plateaus at a healthy 10K RPS. No issues, Happy merchants and shoppers.
- We saw page views peaked Friday at 400M. Our high for Cyber Monday was about 374M. A bit lower.
- We hit our all-time high today of 17,120 RPS at 12:00 Pacific time, compared to the previous record 13,300 RPS on Cyber Monday 2012 — about a 22% growth, 2012 vs 2014. This is up 15% from the 15,580 RPS this last Friday—So while more RPS at peak, the higher “low water” mark of Black Friday morning and night allowed it to surpass Cyber Monday for total page views. Note that many mobile apps don’t capture as a “Page View,” so the large increase in mobile use implies that the true page view number is higher for both days.
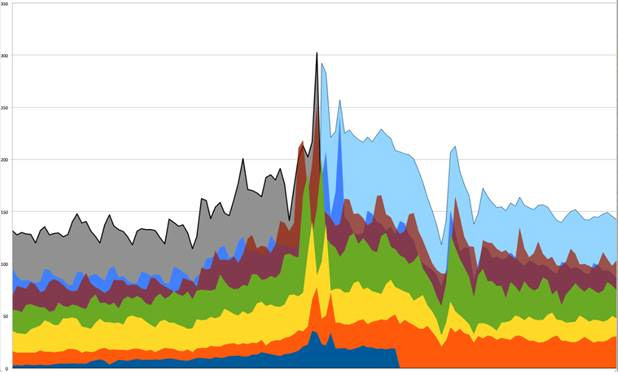
Gray is 2014 recorded traffic for the days leading up to and including Cyber Monday. Light blue is projected traffic estimated from past patterns and current sizes. Scale = Millions of Page Views.
I mentioned above that we greatly expanded our monitoring and our ability to see further into our solutions than ever before. DataDog, our new monitoring tool is very granular—down to the millisecond when we need it to be—and it provides our developers the ability to build custom monitoring into their code. In fact, in 2015, you’ll want to keep a lookout for a public-facing status page on our metrics.
I do get a bit reflective this time of year. I’m thankful to be blessed with one of the best Operations team in my career; the core group has been with me through five of these past holidays (I did say 52 months and running at 100% uptime, right?). I’m thankful to have the best engineers, architecture and infrastructure in the industry and the phenomenal vision of our Product Team and CEO; and of course, thankful to have the best retail merchants as my customers
As I said in the beginning, some things just don’t change. As we wind down the trifecta of online shopping events, I’m already excited for 2015 — build, scale-up, new pricing models, merchandise, engage, more customers and of course more power <manly grunts>! Wash, rinse, repeat… here we go, 2015. We’re ready. Bring it.